geomotif
A library for generating and plotting geometric designs, and for controlling exactly where the points along them land.
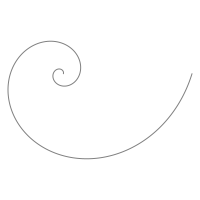
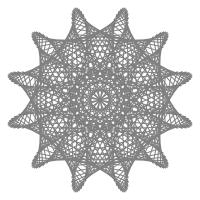
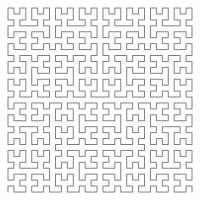
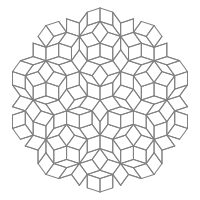
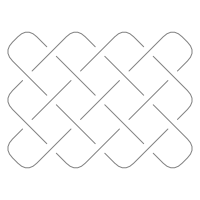
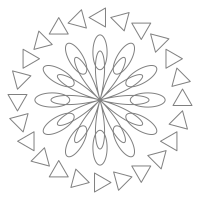
Zero dependencies for the core, Python 3.12+. matplotlib and scipy are optional extras, and nothing on the path from a motif to an SVG file needs either.
The whole mental model
A motif is a parameterized recipe for geometry. Applying a transform to what it produced gives a design, which is what you plot or export.
from geomotif import PowerSpacing
from geomotif.motifs import SpiralBetween

spiral = SpiralBetween(
    start=(200, 0),  # required — first point (always included)
    end=(20, 0),  # required — last point (always included)
    center=(0, 0),  # point the spiral winds around (default shown)
    turns=3,  # extra full revolutions (default 0)
)

design = spiral.generate(120, spacing=PowerSpacing(2.5))

for x, y in design:
    ...
Three sentences is the whole of it:
build()gives a motif at its native resolution — whatever the shape itself says it takes to draw.generate()gives the points you actually want, placed by arc length: equal spacing means the same real x,y distance between every consecutive pair, however tightly the curve winds.- Everything is immutable, and every operation returns something new.
Why arc length is the point
Most plotting code spaces points by parameter — equal steps through whatever variable the formula happens to use. On a spiral that puts the points bunched up at the tight end and stretched out at the wide end, which is not what "100 evenly spaced points" is supposed to mean.
geomotif measures the curve with a dense polyline, builds a cumulative-length
table, and inverts it. That machinery lives in
geomotif.core.sampling and works on polylines
rather than on formulas — so it applies to every motif in the catalog,
including the ones with no closed-form parametrization at all, and to yours.
What is in the box
147 motifs across 19 families: the spirals, the primitives, the named curves, the roulettes, the polar and harmonic families, the fractals, the graph and number art, string art, the tilings — periodic and aperiodic — sacred geometry, guilloché, Islamic strapwork, Celtic knotwork, the polyhedra, the optical illusions, the Voronoi family, symmetric point sets, and the composers that build motifs out of other motifs.
Every one of them is a small declarative object, resamples by arc length, takes every spacing curve, and exports to SVG, DXF, CSV, TXT, JSON, a spec file, an animated GIF, a PNG or JPEG still, and an SVG measured in real millimeters for a pen plotter.
Writing your own motifs
Usually it is the maths and nothing else. Pick the base that matches how your design is defined, and write the one method it asks for:
import math
from dataclasses import dataclass

from geomotif import PolarMotif, register


@register("my-flower", family="polar")
@dataclass(frozen=True, slots=True)
class MyFlower(PolarMotif):
    """A seven-lobed flower with a ripple on it."""

    k: float = 7.0

    def radius(self, theta: float) -> float:
        return math.sin(self.k * theta) + 0.4 * math.cos(17 * theta)
That class now has arc-length resampling, every spacing curve, the transform
layer, SVG/DXF/CSV/JSON export, spec serialization, generated command-line
flags and lookup by name. MyFlower(k=5).generate(400) works, and so does
geomotif render my-flower --k 5 --out flower.svg.
You are not required to inherit at all: anything with a build() -> Design
method satisfies the SupportsBuild
protocol and is accepted everywhere a motif is.
What geomotif is not
Worth saying plainly, so you can tell quickly whether it is the wrong tool:
- Not a rendering engine. No fills, gradients or shading. It produces geometry (strokes and points); fills and gradients come from elsewhere. The raster side (the GIF, PNG and JPEG writers) draws strokes as pixels — antialiasing edges on request — so a picture plays or ships, not so that a canvas can be composited.
- Not a CAD kernel. No booleans, no constraint solving, and no offsetting beyond a simple parallel stroke.
- Not a vector-graphics I/O library. SVG and DXF out, not in.
- Not 3D. The polyhedra are projected to 2D, and that is the extent of it.
Where to go next
- Where the points land — arc length, spacing curves, fixed-step placement, and how a point budget is spread across a design that has several strokes.
- Designs, paths and transforms — the data model, and the operators that turn one shape into a pattern.
- Color, layers and pens — which pen draws which stroke, and what a layer is for.
- Exporting — SVG, DXF, CSV, TXT, JSON, the spec format that records the recipe instead of the points, and snapping to a grid.
- Animation — drawing a design on, spinning it, sweeping a parameter, and writing the frames as a GIF.
- Plotting it for real — paper sizes in real
millimeters, less time with the pen in the air, and the
vpypebridge. - Plotting — the matplotlib helpers, behind
the
plotextra. - The command line —
geomotif render,geomotif explore,geomotif gallery, and where the flags come from. - Extending — the base classes, the conformance contract, and publishing a motif as a plugin.
- API reference — every public module, generated from the docstrings.